| Author |
 Topic Topic  |
|
|
n/a
deleted

5 Posts |
 Posted - 05/10/2008 : 17:18:14 Posted - 05/10/2008 : 17:18:14


|
A basic question that must be addressed in saving copper pennies is " Will the price of copper continue to go up in the future?" Here is my two cents sharing 4 reasons why I believe copper prices will continue to appreciate.
First, the global economy is growing at a fast pace led by the super-economies of China and India. Commodities that were once undervalued are now rising in price due to the simple economic imbalance of supply and demand. It appears that for at least the last decade the world is using more copper than it is producing. Consequently the world's inventory of Copper supplies are way down.
In order to keep up with today�s and tomorrow�s copper demand, mined output will need to increase. Unfortunately, increasing mine production is not as easy as turning a faucet counter-clockwise. As is with all metals, ramping up production and opening up new mines requires significant time and capital. It is during that time, or cycle, that investors have the opportunity to take advantage of rising prices.
Now even though the economic imbalance of copper is prevalent today, we need to keep in mind that copper does not really have the same economic fundamentals as a monetary metal as gold and silver. Copper or copper-alloyed coins were common because it is a cheap metal and there has historically been an abundance of it.
The biggest differences between copper and precious metals, especially gold and silver, are the rarity and store of value factors. According to the Copper Development Association (CDA) of the USA, it is estimated that global copper resources are nearly 6 trillion pounds. The CDA also estimates that throughout history only 700 billion pounds of copper have been mined.
These massive reserves and resources coupled with copper�s high recycle rate show there to be no imminent risk of ever running out. So for copper it is not an issue of rarity or store of value, it is a matter of ramping up supply to meet demand. Just like all commodities, until this happens market forces will adjust the prices accordingly in the upwards direction and give investors the opportunity to go long and profit.
Copper has innumerable industrial uses that are absolutely invaluable. This malleable and ductile metal continues to prove its resiliency and usefulness in virtually every economic sector. It is used heavily in building construction, transportation, electrical, automotive and still telecommunications among many other major industries.
According to the CDA, building construction accounts for 46% of all copper use in America with the average single-family home using 440 pounds of copper. This tells a story in itself as today we are witnessing a global boom in residential and commercial infrastructure, yet another testament as to why global demand for copper has been on the rise.
The bottom line is that barring a global recession, global inventories are down and demand is up as the world economy grows. Very bullish!
Second, In 1930, we found 10 billion new barrels of oil in the world, and we used 1.5 billion. We reached a peak in 1964, when we found 48 billion barrels and used approximately 12 billion. In 1988, we found 23 billion barrels and used 23 billion barrels. That was the crossover when we started finding less than we were using. In 2005, we found about 5-6 billion, and we used 30 billion. As the world starts running out of the easily pumped out oil energy prices will continue to rise and all commodities will generally rise in tandem.
Third, anything priced in dollars will go up as the dollar continues it's slide into worthlessness. There is about nine and half trillion reasons why the dollar will continue to fall in value. The gargantuan, unpayable, growing daily national debt is clearly one of them.
Fourth, commodities are becoming an investment tool of hedge funds, pension funds and others. Hence driving up the prices.
Please share your thoughts on what you think the price of copper will do and why!
Thanks for reading my first post!
|
Learn the lesson of the history of all paper money before you have to learn the lesson the hard way! |
|
|
lukeownzu
Penny Collector Member


364 Posts |
Posted - 05/10/2008 : 17:41:44
|
| I couldn't have said it better :p |
 |
|
|
n/a
deleted
14 Posts |
Posted - 05/10/2008 : 20:11:57
|
| Does anyone know what the highest inflation adjusted price for copper has been over the last 50 years? |
|
|
|
NotABigDeal
1000+ Penny Miser Member


USA
3890 Posts |
Posted - 05/10/2008 : 22:41:22
|
Re-reading your first post, my-2-cents....Hehe.
Deal |
Live free or die.
Plain and simple.
"If you love wealth more than liberty, the tranquility of servitude better than the animating contest of freedom, depart from us in peace. We ask not your council or your arms. Crouch down and lick the hand that feeds you. May your chains rest lightly upon you and may posterity forget that you were our countrymen."
- Samuel Adams |
|
|
|
HoardCopperByTheTon
Administrator


USA
6807 Posts |
Posted - 05/10/2008 : 23:04:29
|
| 5th) Chile can't generate enough power to run their mines. |
If your percentages are low.. just sort more. If your percentages are high.. just sort more.
Now selling Copper pennies. 1.6x plus shipping. Limited amounts available. |
|
|
|
fiatboy
Administrator
912 Posts |
Posted - 05/10/2008 : 23:40:20
|
quote:
Does anyone know what the highest inflation adjusted price for copper has been over the last 50 years?
That's something I'd like to see, as well. All the charts I've found, however, use very dubious numbers to calculate inflation.
I've seen some good charts over the years, but now I can't find them. grrrr.....
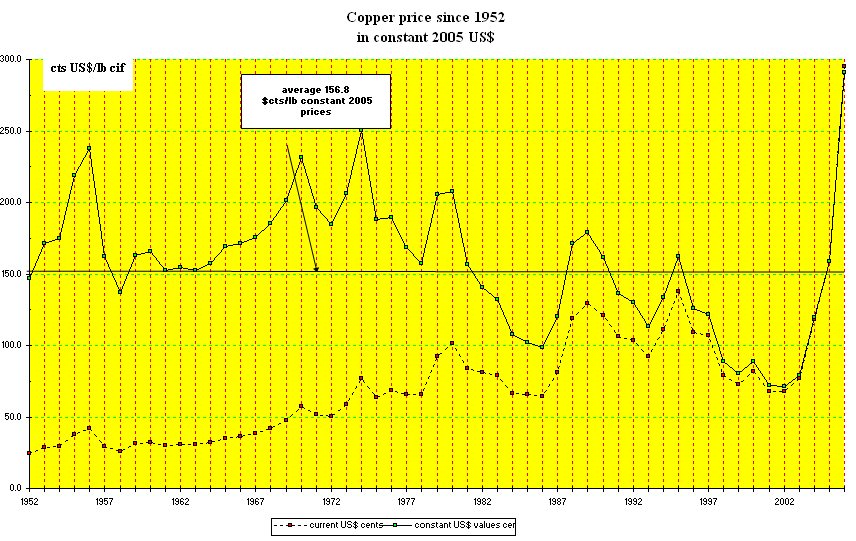
This one is probably the most famous long-term historical copper price chart. I can't attest to its accuracy, and honestly, I think it's using flawed data, but it's the best I could find. Can anyone do better? I know good historical copper charts are out there!
|
"Bart, it's not about how many stocks you have, it's about how much copper wire you can get out of the building." --- Homer Simpson |
|
|
|
topeka
Penny Pincher Member


160 Posts |
Posted - 05/11/2008 : 05:14:06
|
Using " Copper statistics 1900-2007 US Geological survey" combined with "The Inflation Calculator"
Copper was selling for 16 cents a pound in 1900
Inflation adjusted = $3.93/lb in 2007
The price of copper may simply be a reflection of the dollars true worth. |
Silver..poor mans gold
Copper..peasant silver |
|
|
|
fiatboy
Administrator
912 Posts |
Posted - 05/11/2008 : 06:06:51
|
quote:
The price of copper may simply be a reflection of the dollars true worth.
Yep---the POC/USD correlation must be high. |
"Bart, it's not about how many stocks you have, it's about how much copper wire you can get out of the building." --- Homer Simpson |
|
|
|
Tourney64
1000+ Penny Miser Member

USA
1035 Posts |
Posted - 05/11/2008 : 06:26:37
|
| Another reason that there is less reason for copper prices to fall - As the price of copper increases the mine workers go on strike demaning higher pay. In order for the mines to remain profitable, they have to a certain price. If they don't get that price, they will reduce their production to only those mines that are better producers. They shut down the marginally profitable mines until the price rises. |
|
|
|
n/a
deleted

13 Posts |
Posted - 05/11/2008 : 07:07:12
|
| I remember hearing a NPR story that said that out of all the copper in the world that 1/3 was in use, 1/3 was in the ground and the last 1/3 was in the DUMP....... So was this story inaccurate or are the CDA numbers stated above overly optimistic?? |
Another long day in the copper mines |
|
|
|
n/a
deleted
5 Posts |
Posted - 05/11/2008 : 07:23:14
|
Yes and it is not a particularly stable country geopolitically. Also, I believe Chile is the largest producer of copper in the world.
quote:
Originally posted by HoardCopperByTheTon
5th) Chile can't generate enough power to run their mines.
|
Learn the lesson of the history of all paper money before you have to learn the lesson the hard way! |
|
|
|
n/a
deleted
5 Posts |
Posted - 05/11/2008 : 07:27:46
|
Look closely at the chart. What is it saying? I have just now edited my reply because I'm not sure what the chart means. Is it saying that the price of copper in real terms is the cheapest as it has been in over 50 years or that it is actually at the highest point and may indicate pressures to come down to more of it's average price range?
quote:
Originally posted by fiatboy
quote:
Does anyone know what the highest inflation adjusted price for copper has been over the last 50 years?
That's something I'd like to see, as well. All the charts I've found, however, use very dubious numbers to calculate inflation.
I've seen some good charts over the years, but now I can't find them. grrrr.....
This one is probably the most famous long-term historical copper price chart. I can't attest to its accuracy, and honestly, I think it's using flawed data, but it's the best I could find. Can anyone do better? I know good historical copper charts are out there!
|
Learn the lesson of the history of all paper money before you have to learn the lesson the hard way! |
Edited by - n/a on 05/12/2008 07:43:30 |
|
|
|
n/a
deleted
5 Posts |
Posted - 05/11/2008 : 07:34:51
|
This is an ecellent question! I would love to see the answer. I was merely quoting research found on the web. Things turning out right often follow the pattern of ask the right question, get accurate answers, take decisive action!
quote:
Originally posted by ejszyper
I remember hearing a NPR story that said that out of all the copper in the world that 1/3 was in use, 1/3 was in the ground and the last 1/3 was in the DUMP....... So was this story inaccurate or are the CDA numbers stated above overly optimistic??
|
Learn the lesson of the history of all paper money before you have to learn the lesson the hard way! |
|
|
|
n/a
deleted
13 Posts |
Posted - 05/11/2008 : 08:05:25
|
I found the story......
You must be logged in to see this link.
My memory was a bit flawed, the 1/3's were here in the US, worldwide its a 1/4 thats out of the ground. A little less dramatic I suppose, but with China and India coming into play copper will also be used much faster than anytime in histoy. At least thats my view...
E |
Another long day in the copper mines |
|
|
|
n/a
deleted
13 Posts |
Posted - 05/11/2008 : 08:07:26
|
Also.......
note the very last sentence of that article........ Science is on our side! |
Another long day in the copper mines |
|
|
|
c140cessna
Penny Collector Member

USA
419 Posts |
Posted - 05/11/2008 : 09:11:47
|
I'd like to see a chart of Copper:Gold ratio.....except for investment demand spikes for gold....like 1980....this should be a pretty good indicator of the "Real Price of Copper"....in my opinion, gold has been and will continue to be the only stable money basis for comparison.
Remember the story that 1 ozt of gold over the past 5000 years has the same purchasing power: will buy a man a well made suit, a nice pair of shoes and a nice dinner....pretty much constant over the 5000 year history.
Where can we find basic data like this to construct our own charts...like raw data in a spreadsheet.....monthly or annual data for the price of various metals??? Would prefer data in spreadsheet as to not have to enter the raw data.... |
Edited by - c140cessna on 05/11/2008 09:19:48 |
|
|
|
Saul Mine
Penny Collector Member

USA
343 Posts |
Posted - 05/11/2008 : 09:51:28
|
A pound of copper seems to hold very close to a gallon of gas.
Prices in USD are not informative because the USD has been going down for the last century. For measuring value, the USD is a rubber ruler. Ratios between commodities are much more meaningful, being aware that ratios change too. Prior to the 20th century gold was 20 x silver but about 1890 it jumped to 100 and has been wildly erratic since then. If gas was 16 cents in 1906 then gold was 129 x, but now it is 215 x. Steel now is about half as costly as it was 60 years ago because of improved refining methods. But in general, metals are a good base for figuring relative values over time. They say two ounces of gold will always get you a good suit, and that seems to be true any time conditions are stable enough that you would want a good suit.
We need to be aware of supply fundamentals, but we also need to be aware that supply depends on things that might surprise you. As Tourney64 mentioned, mines dig less profitable ore when prices are up and richer ore when prices go down. That doesn't make anybody rich, but it keeps the mine stable.
Gas must be the second most hyped commodity in the world (after diamonds). The price hardly changes a whit in real terms, even though all the fundamentals say it ought to be a lot more expensive. |
A penny sorted is a penny earned!
Please use tinyurl.com to post links. Long links make posts hard to read. |
|
|
|
topeka
Penny Pincher Member
160 Posts |
Posted - 05/12/2008 : 17:24:21
|
c140cessna
I think you can find the statistics you are looking for in the US geological survey site. |
Silver..poor mans gold
Copper..peasant silver |
|
|
| |
Topic |
|


